



Table of Contents
ToggleInventory forecasting software exists because guessing is expensive, and most businesses don’t realize how expensive until they see the number written down. Globally, out-of-stocks and overstocks cost retailers $1.77 trillion in 2025, according to IHL Group’s most recent research, published in April 2026, with theft, internal inefficiencies, and supplier missteps each contributing hundreds of billions to that total.
That number sounds like a problem for giant chains, not a $10M distributor running lean with a small team. But the underlying issue is the same at any size: too much cash sitting in stock that isn’t moving. The U.S. Census Bureau’s most recent Manufacturing and Trade Inventories and Sales report put the total business inventories-to-sales ratio at 1.32 as of March 2026, meaning businesses nationally were holding roughly a month and a third of sales in stock at any given time. That’s capital parked in a warehouse instead of working for the business.
This is what actually happens when forecasting goes wrong, why it happens more often than most owners think, and where software genuinely changes the outcome instead of just producing a nicer-looking spreadsheet.
The Two Ways Inventory Forecasting Fails, and What Each One Actually Costs You
Both failure modes come from the same root cause: a forecast built on last month’s average instead of what’s actually driving demand right now. But the two mistakes hit your business very differently, and it helps to look at them separately.
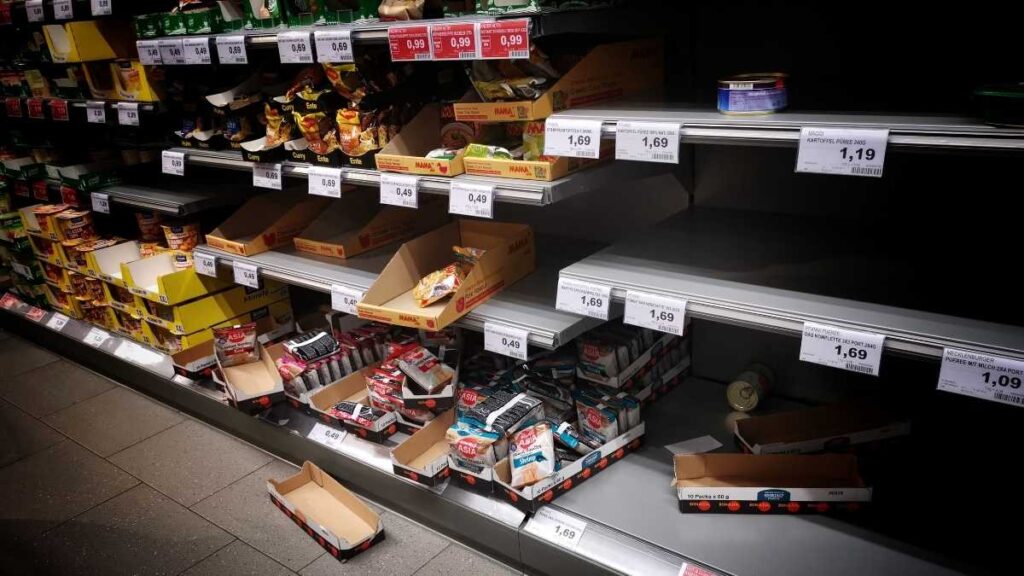
- Stockouts From Underestimating Demand: A product sells faster than expected, the reorder point was set too low, and by the time anyone notices, the shelf or listing is empty. Say a $20M distributor runs out of a top-selling SKU for three weeks during peak season. That’s not just the missed revenue on those weeks; it’s the customer who found the same product from a competitor and may not come back for the next order either.
- Overstock From Overestimating Demand: A forecast built on an unusually strong season gets carried forward as the new baseline, leading the purchasing team to order more inventory than actual demand supports. The excess inventory remains on the balance sheet as stock rather than converting into revenue, tying up working capital, increasing storage and carrying costs, and often requiring markdowns that reduce gross margins before it is eventually sold.
The Census Bureau’s inventories-to-sales ratio is a useful early warning sign for the second problem specifically. It measures roughly how many months of sales a business is holding in stock at any given time, and when that ratio climbs quarter over quarter without a matching rise in sales, it’s usually a sign that purchasing decisions are running ahead of actual demand, not responding to it. Watching that number, or the equivalent for your own business, catches overstock building up before it turns into a clearance sale.
Where Inventory Forecasting Software Actually Earns Its Keep
Good inventory forecasting software doesn’t just automate the math a planner would eventually get to by hand. It catches patterns a spreadsheet realistically can’t, because nobody has time to manually rebuild a demand model for every SKU every week.

A spreadsheet-based reorder process usually works off a simple average: take the last few months of sales, divide by time, set a reorder point. That approach falls apart the moment demand isn’t flat, and demand is rarely flat. A product with a seasonal spike, a promotional bump, or a slow decline as it ages out gets the same static formula applied to it as everything else, which is exactly how a business ends up stocking out of its best sellers in December and sitting on excess of a product that peaked in July.
The gap between wanting this and actually having it is wider than most distributors expect. A 2026 survey of 426 distribution leaders by NAW and Modern Distribution Management found that 73% expected measurable results from AI-powered tools like demand forecasting, but only 16% had actually achieved them. That’s not a sign the technology doesn’t work. It’s a sign that most businesses buy the software and stop there, without the reorder logic, clean sales history, and process changes that make the forecast something people actually act on.
Connecting Forecasting to the Books, Not Just the Warehouse
A forecast that lives only in your inventory system misses half the picture. The other half is what your accounting software for retail business use is telling you about cash position, and the two need to talk to each other, not run on separate timelines making separate decisions.

Here’s how that gap actually plays out. Your forecasting tool flags that a top-selling product needs a large reorder next month, and the recommendation is accurate, demand really is picking up. But if that system has no visibility into your current cash position, it has no way of knowing you’ve also got a large tax payment due the same week, a supplier invoice on 30-day terms about to come due, and a slower month behind you that hasn’t fully hit your bank balance yet. The forecast was right about the product. It was wrong about the timing, because it was never looking at the whole business.
This is where a lot of good forecasting tools quietly underdeliver, not because the demand prediction is wrong, but because it’s disconnected from the finance side that determines whether you can actually act on it. Retail accounting software that syncs with your inventory platform closes that gap, feeding real cash flow data back into purchasing decisions instead of treating inventory and finance as two departments that happen to report on the same business. That’s part of why accounting for retail business works best when both sides are built as one connected system from the start, rather than bolted together after the fact.
An accountant in retail who understands both sides of that equation, the demand math and the cash math, is the difference between a forecast that’s technically correct and one you can actually execute on without creating a cash flow problem somewhere else.
Signs Your Inventory Forecasting Software Isn't Doing Its Job
Some of these are obvious once you’re looking for them. Others hide in plain sight because the business still technically functions, just less efficiently than it should.

- Reorder Points Haven’t Been Updated in Over a Year: Demand shifts. A reorder point calculated during last year’s sales pattern is quietly wrong for this year’s.
- The Same SKUs Are Stocking Out Every Quarter: If a product runs out on a predictable cycle, that’s not bad luck; it’s a forecasting gap that’s been left unaddressed.
- Nobody Can Explain Why a Specific Product Is Overstocked: If the answer is a shrug, the purchasing decision wasn’t based on a real forecast to begin with.
- Inventory and Cash Flow Are Reviewed in Separate Meetings: When forecasting and finance aren’t looking at the same numbers at the same time, decisions get made in isolation that don’t hold up together.
Final Thoughts
Poor inventory forecasting isn’t a minor inefficiency. Globally, it’s a $1.77 trillion problem, and at the scale of an individual business, it shows up as stockouts costing you sales and overstock tying up cash you could be using elsewhere. Inventory forecasting software closes that gap by catching demand patterns a spreadsheet can’t keep up with, but it only works fully when it’s paired with accounting for retail businesses that’s built to work alongside it, not running as a separate system making separate decisions.
For more on how VNC Global connects inventory and financial planning specifically, our page on inventory forecasting and working capital management covers the details.
Ready to stop guessing on reorder points? VNC Global works with U.S. product businesses to connect inventory forecasting with the accounting side, so purchasing decisions are based on real demand and real cash position, not a static spreadsheet.
Visit vncglobalgroup.com and book a free 30-minute advisory session to see where your current forecasting is quietly costing you stockouts, overstock, or both.
Frequently Asked Questions
Inventory forecasting software analyzes historical sales, seasonality, and demand trends to predict how much stock a business will need in future periods, helping set accurate reorder points and reduce both stockouts and overstock.
It’s a Census Bureau metric showing how many months of sales a business is holding in inventory at any given time. As of March 2026, the national figure stood at 1.32. A ratio that climbs without a matching rise in sales usually signals forecasting is falling behind actual demand.
Not yet, in most cases. A 2026 survey of 426 distribution leaders found 73% expected measurable results from AI tools, but only 16% had achieved them, largely because the software alone isn’t enough without clean data and the right processes around it.
It should. A forecast that ignores cash position can recommend a reorder at exactly the wrong time for your working capital. Retail accounting software that syncs with inventory data gives a fuller, more usable picture than either system alone.
An accountant in retail is the person who connects what the forecast recommends to what the business can actually afford to act on, catching timing conflicts between a reorder and cash flow that a forecasting tool alone won’t see.
At least quarterly, and sooner after any noticeable shift in demand. A reorder point calculated on last year’s sales pattern is often already out of date.